Deep Research for Africa's Energy Markets
SAPP day-ahead prices. Eskom station build-up. NERSA tariff rulings. 80+ live market series across 6 providers. Zorora connects the sources your analysts already use and synthesizes them into cited research reports, acquisition diligence, and regulatory intelligence.
What You Get
The Intelligence Your Analysts Assemble Manually — Automated
NERSA tariff decisions in government gazettes. SAPP DAM pricing in hourly feeds. Eskom station build-up in operational CSVs. Your analysts piece these together by hand. Zorora does it in minutes, with citations.
Deep Research
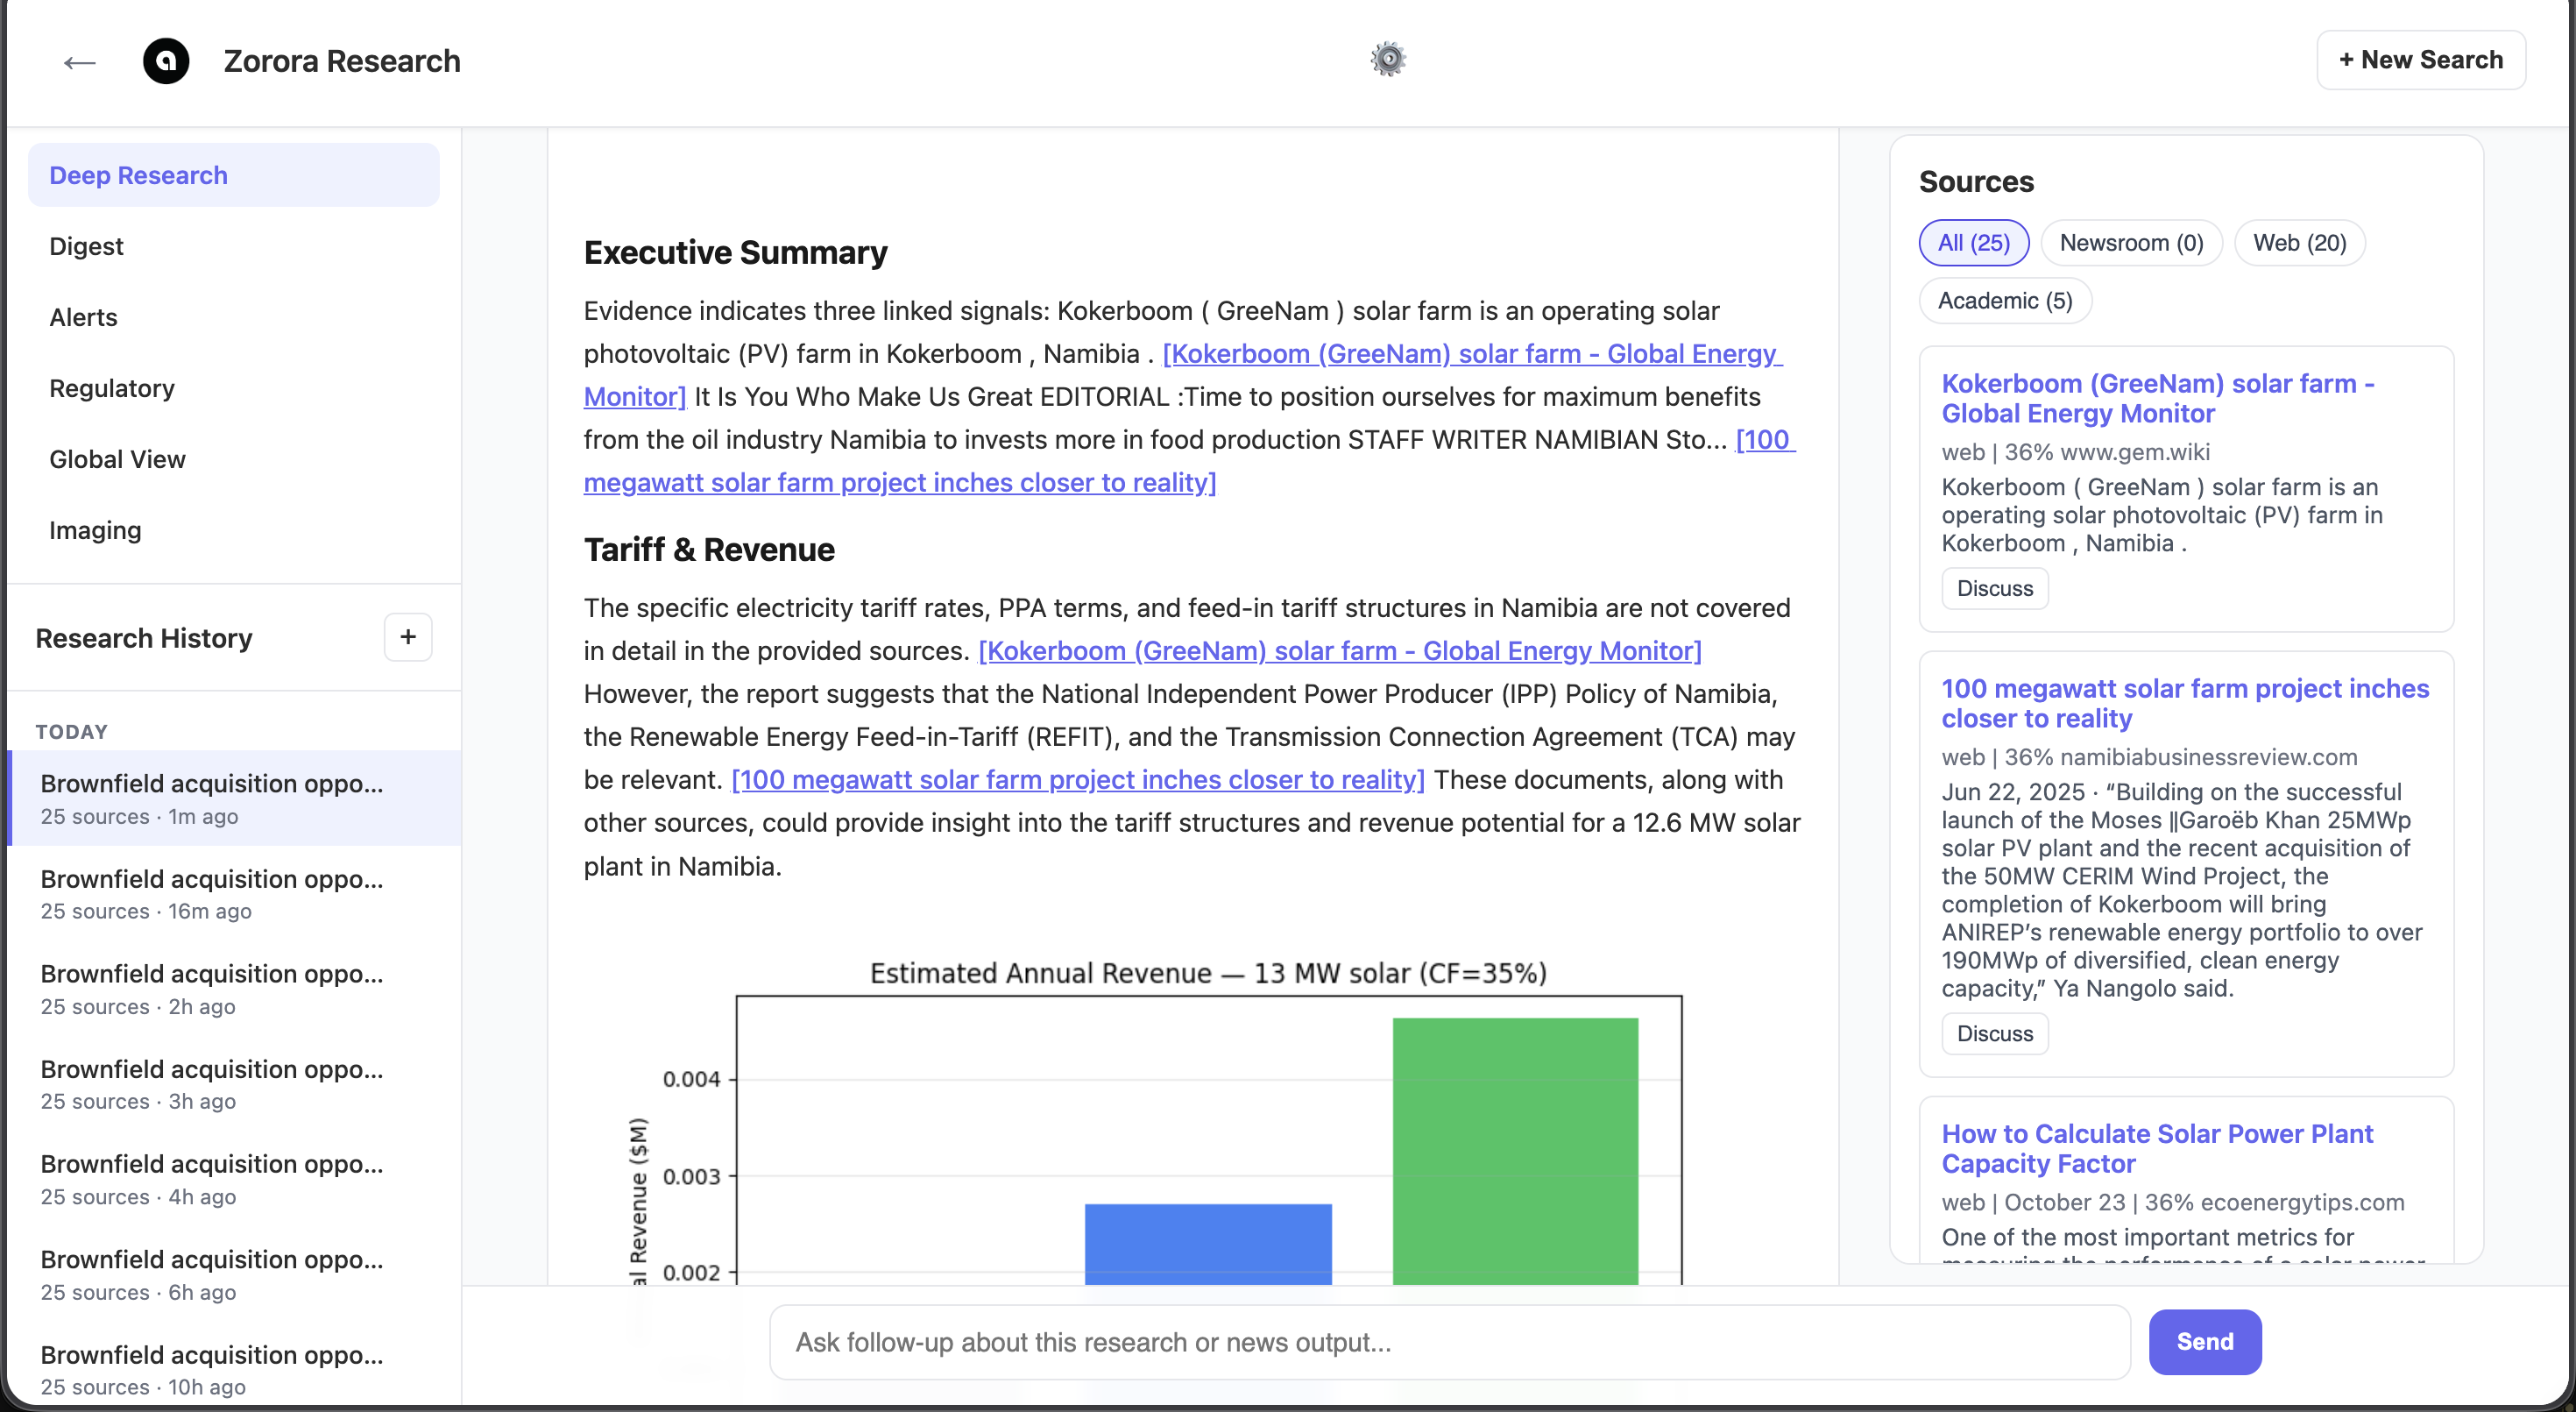
Cited Reports, Not Chat Answers
Ask Zorora a research question and get a structured report with inline citations, revenue projections, and embedded charts — not a chatbot response you can't trace back to a source.
Every claim cites its source. When sources disagree, Zorora tells you exactly where and why. The AI behind it — Nehanda v3 — is a 27B parameter model trained on 490+ energy policy documents to refuse fabrication, not optimize for plausibility.
- Structured reports with inline source citations
- Credibility-scored sources — high-confidence evidence ranks first
- Revenue estimates, tariff structures, and regulatory context
- Follow-up questions grounded in the same source material
Asset Mapping
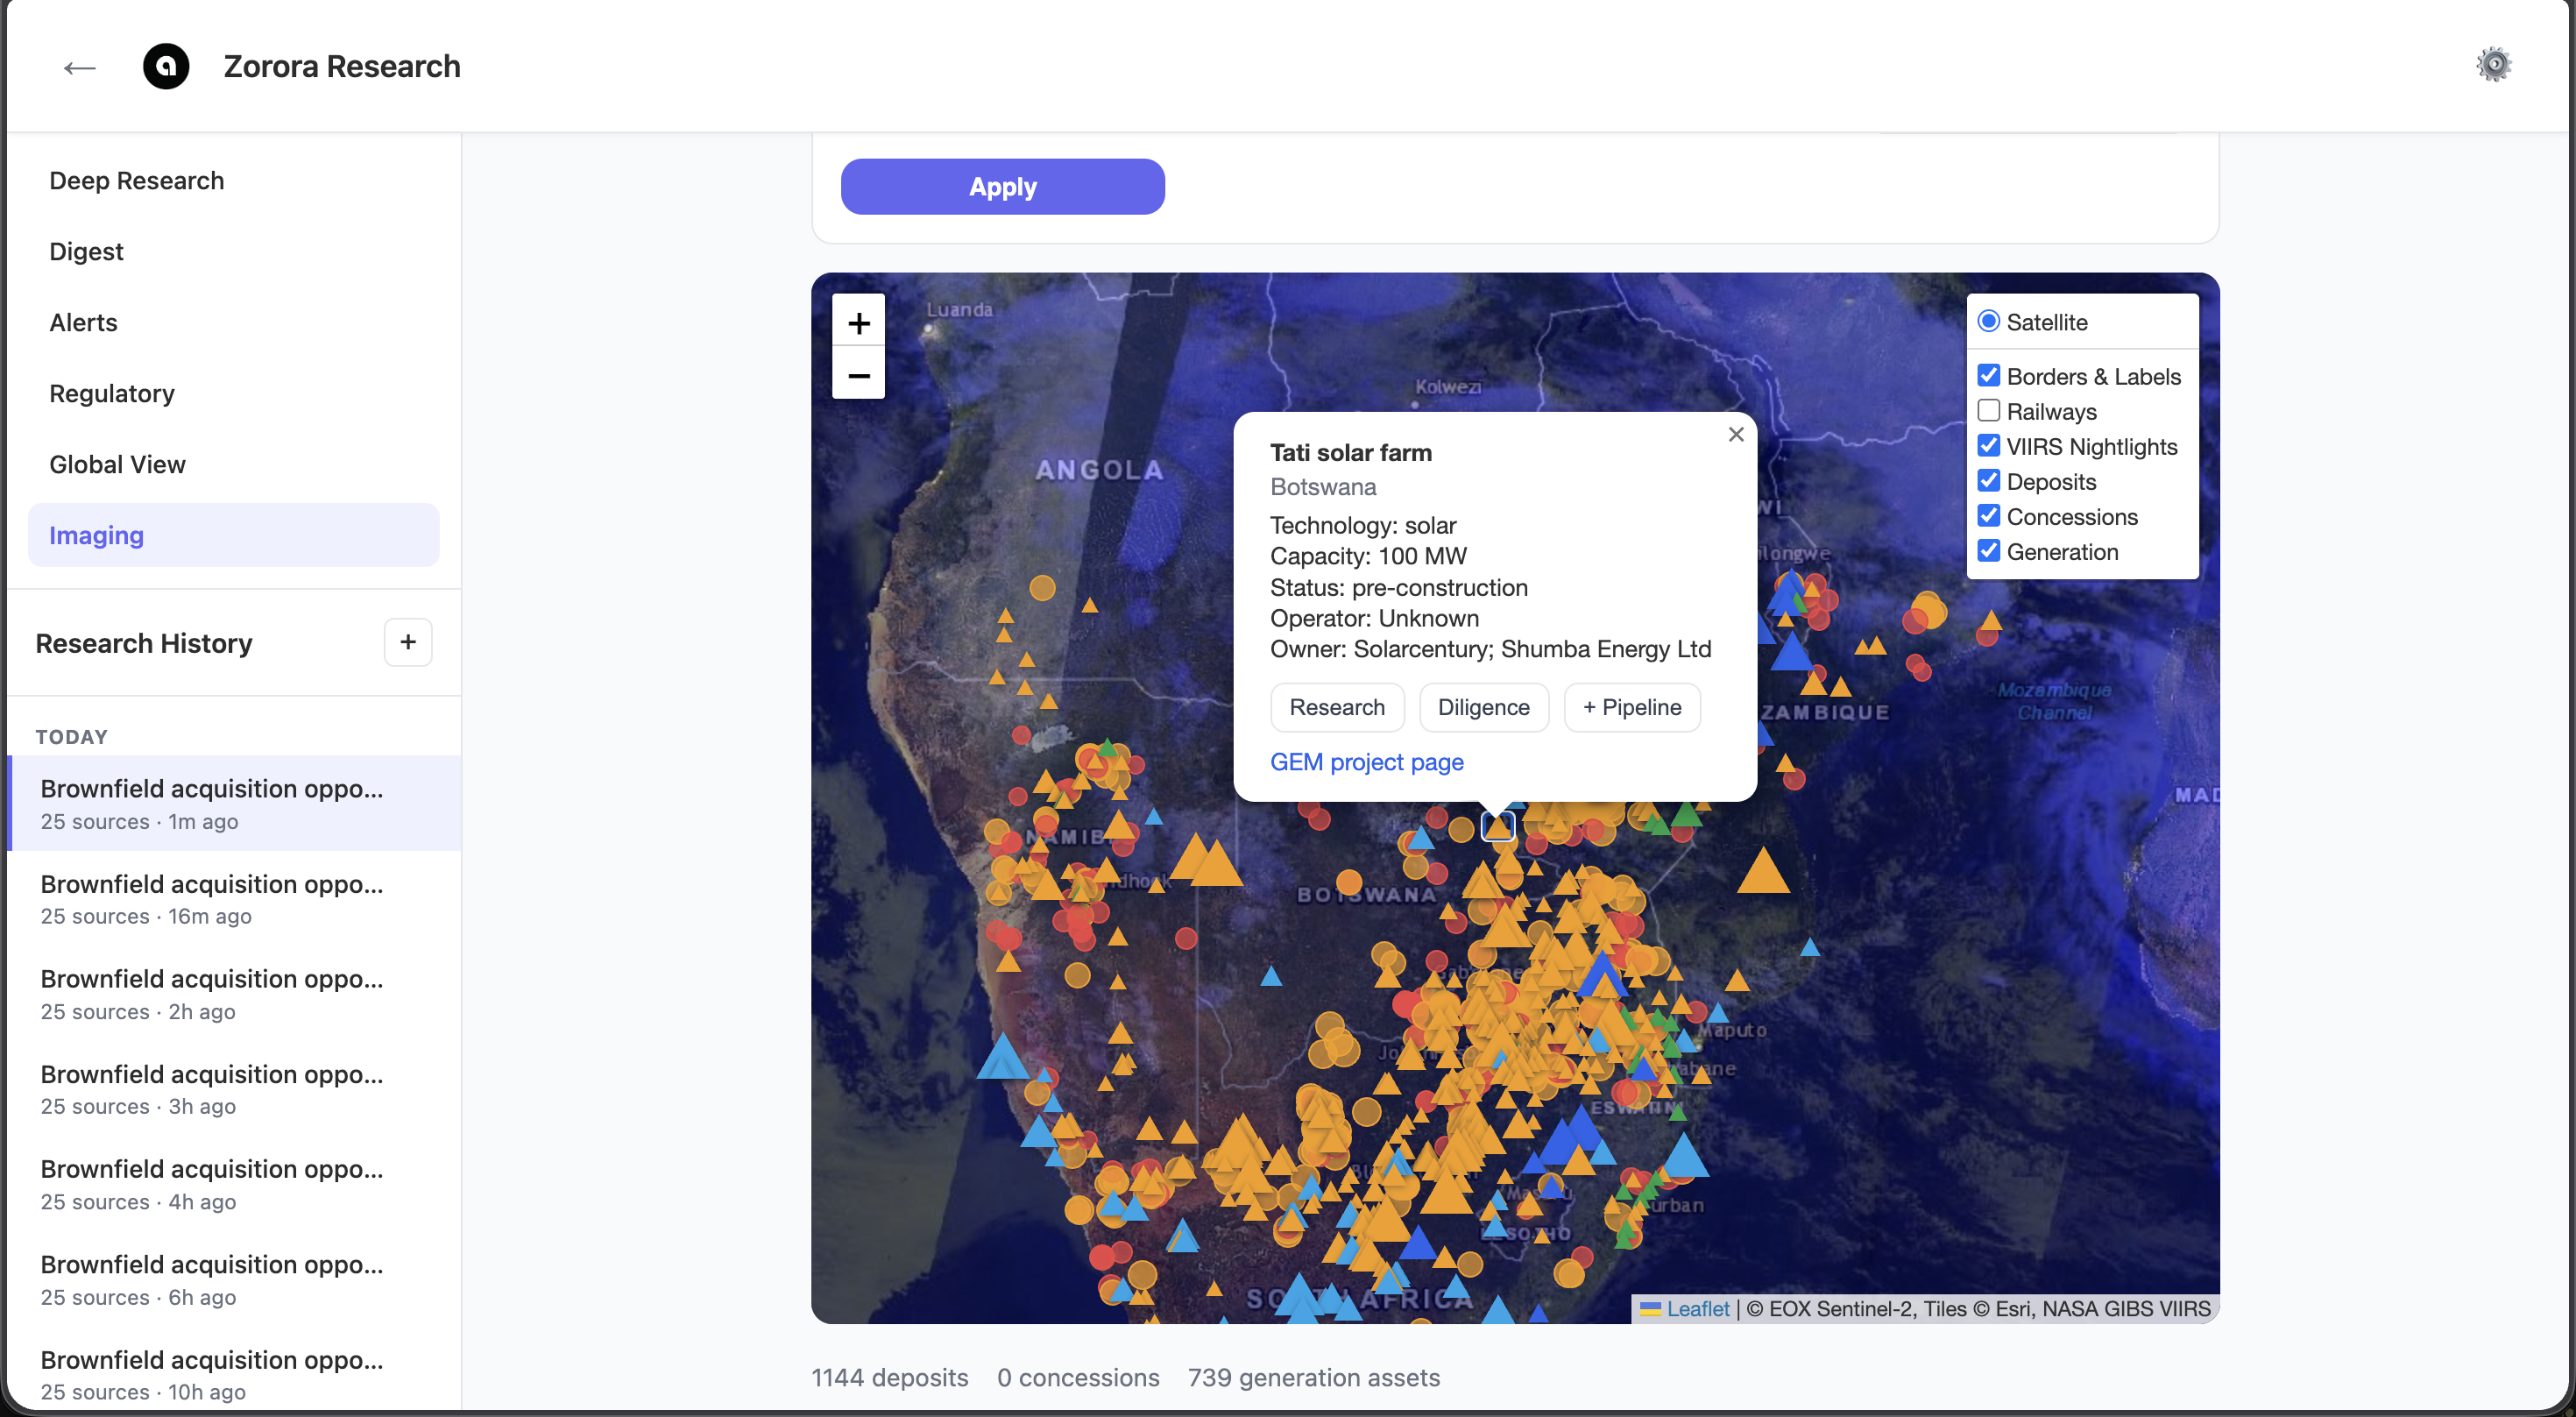
See Every Generation Asset on the Map
1,144 mineral deposits. 739 generation assets. Satellite imagery with night-light overlays. Click any asset and get its capacity, technology, ownership, and construction status — then launch a diligence search or research report directly from the map.
- Sentinel-2 satellite imagery with VIIRS night-lights
- Generation assets with capacity, operator, and status
- Mineral deposits and mining concessions
- One-click diligence from any asset popup
Regulatory Monitoring
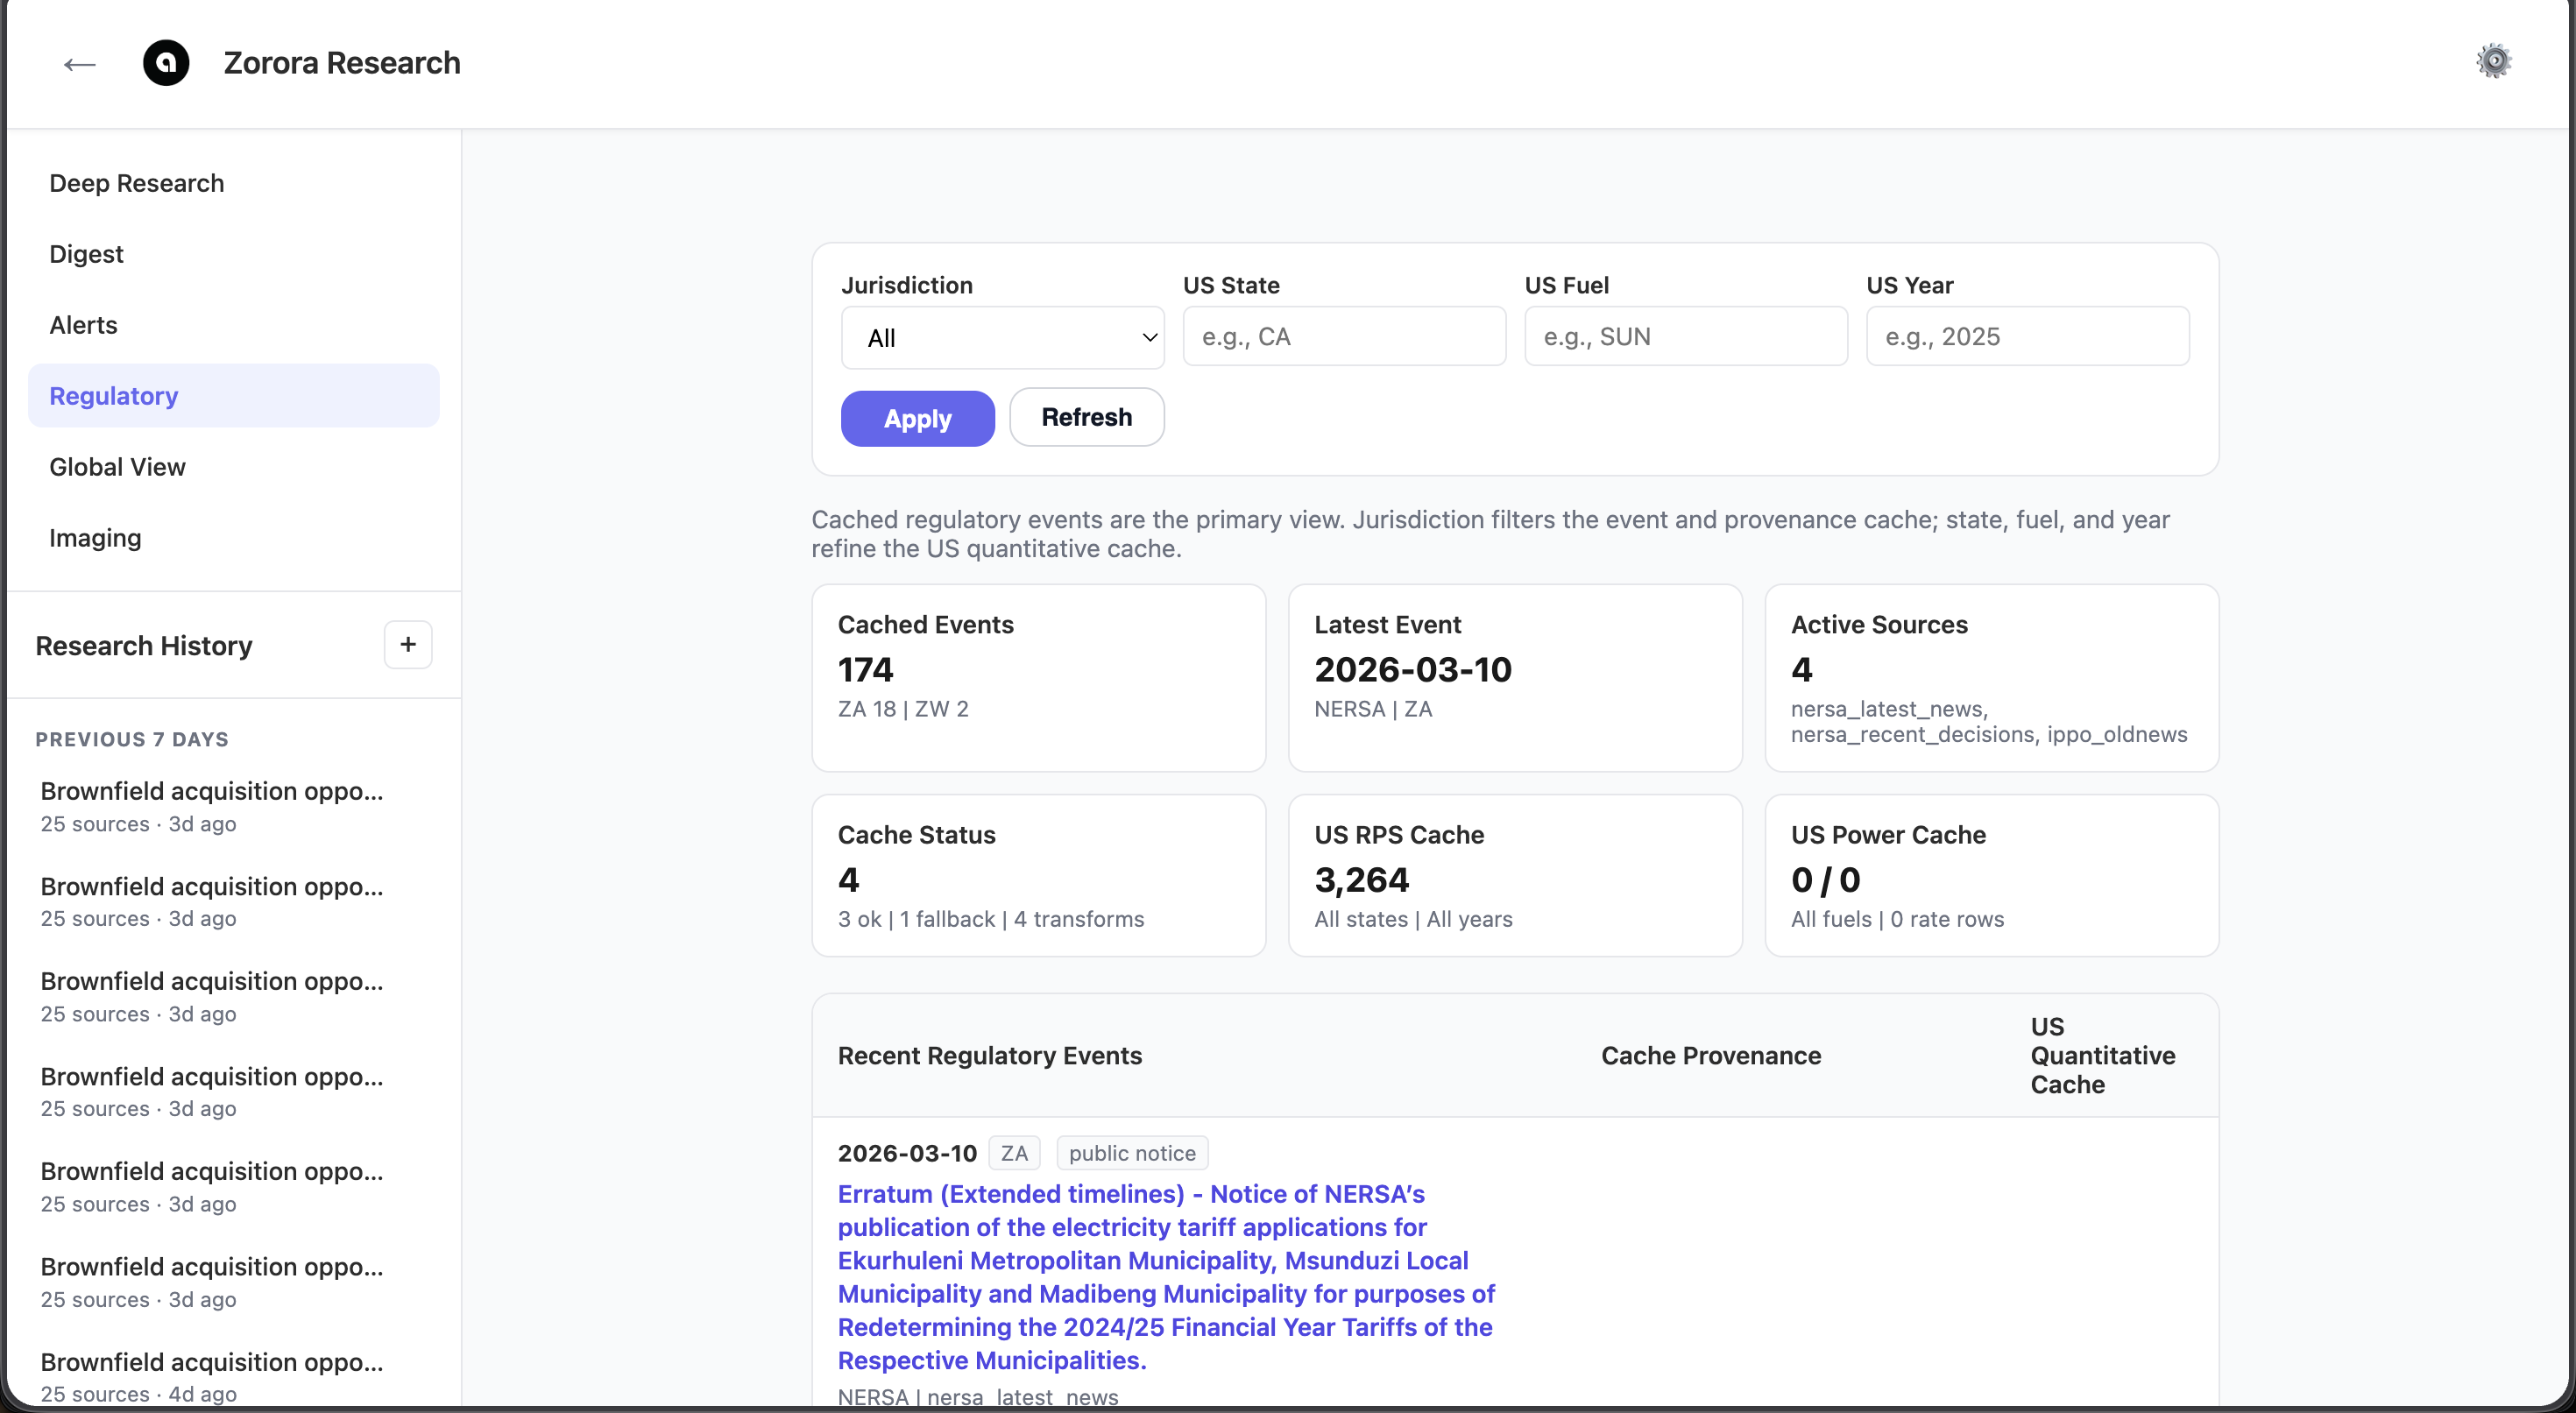
Track the Rulings That Move Markets
174 cached regulatory events across South Africa, Zimbabwe, and the US. NERSA tariff decisions, ZERA licensing notices, FERC orders, and state RPS compliance data — filtered by jurisdiction, fuel type, state, and year.
A NERSA notice about municipal tariff redetermination for Ekurhuleni, Msunduzi, or Madibeng changes the economics of every asset in those service areas. Zorora surfaces these events automatically — before your competitors find them in the gazette.
- 174 regulatory events cached with provenance tracking
- 3,264 US RPS compliance records across all states
- Filter by jurisdiction, state, fuel type, and year
- Configurable alerts when new rulings arrive
Global View
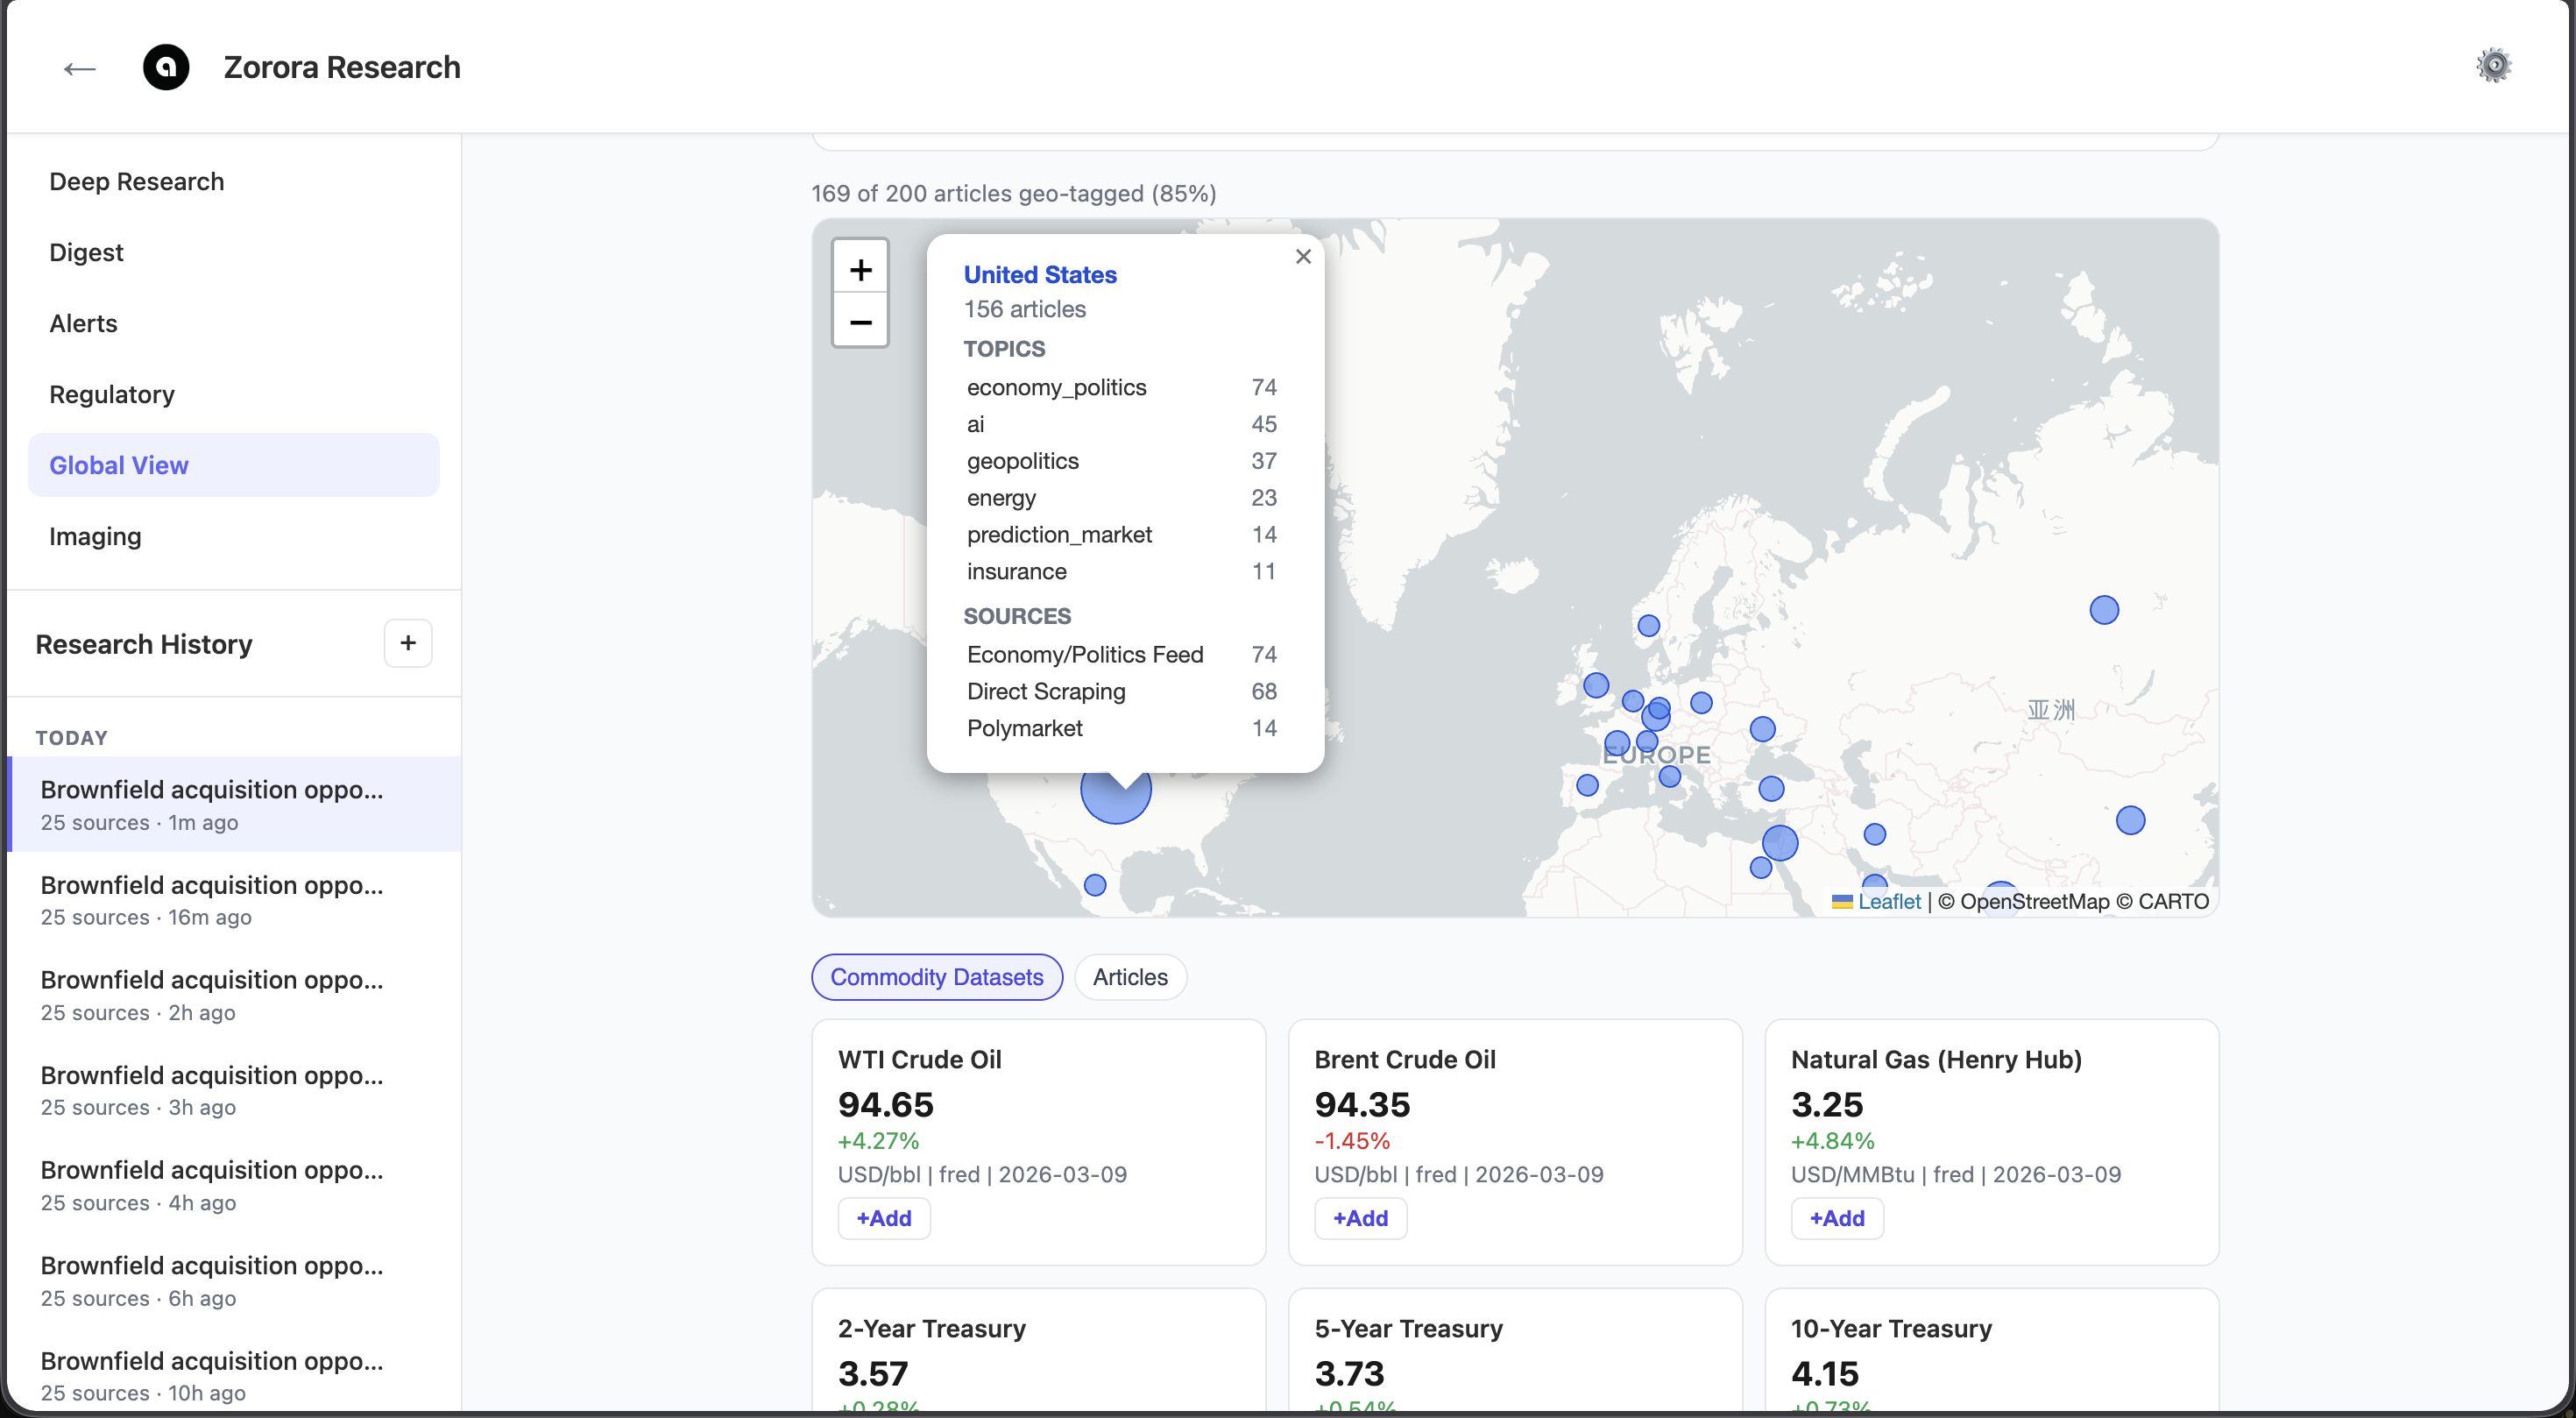
Markets, Commodities, and News by Geography
Live commodity pricing — WTI at $94.65, Brent at $94.35, Henry Hub at $3.25 — alongside treasury rates and geo-tagged article feeds broken down by country and topic. Click a country and see what's being written about it: economy, geopolitics, energy policy, AI, prediction markets.
Stage any commodity dataset or article into a digest and get a synthesized market brief you can forward to your investment committee.
- FRED commodity and treasury data with daily updates
- Geo-tagged articles across 169 countries with topic breakdown
- Stage datasets and articles into shareable digest reports
- Polymarket prediction data for geopolitical event tracking
Data
The Sources Your Analysts Already Use — Connected
Zorora pulls from the same regulatory feeds, market data providers, and academic databases your team queries manually. The difference is they're all in one place.
Why Zorora
Energy Projects Fail for Reasons That Don't Show Up in Financial Models
Grid connection delays. Municipal tariff disputes. Environmental permitting gaps. Counterparty exposure to an O&M contractor that lost its CIDB accreditation. The risks that kill energy deals are rarely financial — they're regulatory, political, and operational. And the records are scarce, scattered across government gazettes, regulatory feeds, and local newsrooms in formats no spreadsheet can aggregate.
Zorora exists because derisking a project in Southern Africa requires surfacing the specific non-financial factors that determine whether it actually reaches commercial operation — and those factors live in government gazettes, NERSA notices, and municipal filings that ChatGPT can't even find.
- Surfaces regulatory, environmental, and counterparty risks from African sources
- Tracks NERSA, ZERA, and municipal events that change project economics
- Synthesizes scarce records into structured intelligence — not summaries of summaries
- Powered by Nehanda v3 — 27B parameters, 490+ energy policy documents, refuses to fabricate
Failure
None of these risks show up in a financial model. All of them kill projects.
The Model
Nehanda v3 — Purpose-Built for Energy RAG Synthesis
Zorora's synthesis engine is Nehanda v3 — a 27B multimodal model built on Qwen3.6 VL with native vision, 262K context, and epistemic alignment that carries across base model upgrades.
A Deep Research Model Trained on Epistemics
Nehanda v3 is trained on how to reason with evidence. Five stages of epistemic alignment teach the model to synthesize ranked sources with inline citations, preserve conflicts between sources instead of picking a winner, correct false premises instead of agreeing, and refuse to fabricate when the evidence isn't there.
The energy intelligence comes from the sources Zorora feeds it. The quality of the reasoning is Nehanda's job.
Built on Qwen3.6 VL with a 262K native context window and an integrated vision encoder, Nehanda v3 can process full regulatory documents in a single pass and ingest PDFs directly as images — no OCR pipeline, no artifacts.
Pricing
Try It for Less Than a Single Analyst Hour.
Every tier runs the same Nehanda v3 model and accesses the same data sources. Higher tiers unlock unlimited queries, team features, and the scouting pipeline.
- 10 deep research queries per month
- Full market data & Global View
- Regulatory event feed
- Single user
- Unlimited deep research
- Full market data & SAPP/Eskom feeds
- Discovery & satellite asset mapping
- Regulatory monitoring & alerts
- Digest synthesis & export
- Everything in Professional
- Scouting pipeline (5-stage kanban)
- Automated feasibility studies
- Custom SME knowledge corpus
- API access & SSO
- Priority model inference
On-premise deployment with commercial license available for regulated entities. Email us for custom pricing.
See Zorora on Your Portfolio
Schedule a 30-minute demo and we'll run a live research query on an asset or market you're evaluating.